Imagine a world where raising taxes could actually shrink government coffers, or lowering them might boost revenue.
This paradoxical idea is at the core of the Laffer Curve, a concept that has reshaped economic debates for decades.
It illustrates a fundamental trade-off in taxation that every citizen and policymaker should understand.
By exploring this curve, we uncover not just theory, but real-world implications for growth, equity, and prosperity.
Let's dive into the intricacies of this model to see how it can inspire smarter financial decisions and a more resilient economy.
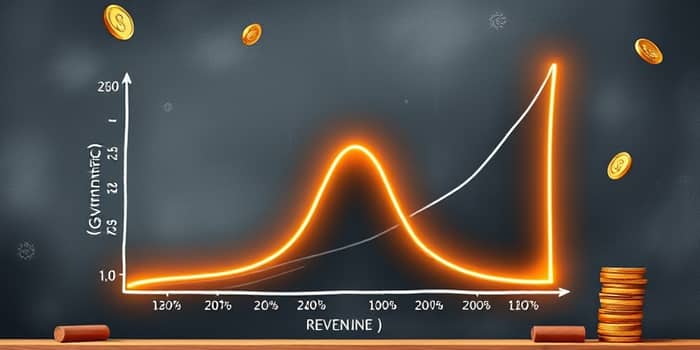
The Laffer Curve is a graphical tool that depicts the relationship between tax rates and government tax revenue.
It shows that revenue is low at both 0% and 100% tax rates, with an optimal point in between.
This revenue-maximizing point, often labeled T*, represents where tax collection peaks without stifling economic activity.
The curve teaches us that taxation isn't just about arithmetic; it's about human behavior and incentives.
At 0%, there's no revenue because nothing is taxed, while at 100%, no one has reason to work or earn income.
This simple yet powerful idea challenges conventional wisdom and opens doors to innovative policy thinking.
The curve gained fame in 1974 when economist Arthur Laffer sketched it on a napkin during a dinner conversation.
He was explaining the concept to a White House aide, aiming to counter the dominant Keynesian views of the time.
However, Laffer didn't invent the idea from scratch; antecedents trace back to 14th-century scholar Ibn Khaldun.
Laffer's contribution was in popularizing it during an era focused on demand-side economics.
He argued that the real issue was heavy taxes and regulations that discouraged production, not lack of demand.
This historical context adds depth to why the curve remains relevant in modern fiscal discussions.
Laffer's model hinges on two interacting mechanisms that explain how tax rates influence revenue.
First, the arithmetic effect: revenue equals the tax rate multiplied by the tax base.
This is straightforward math, but it's only part of the story.
Second, the economic effect: tax rates affect the tax base itself by altering incentives.
Higher taxes can reduce people's willingness to work, earn, or engage in taxable activities.
This behavioral response means that as rates rise, the base might shrink, complicating revenue predictions.
Understanding these effects helps policymakers avoid simplistic tax adjustments.
When tax rates increase, three main consequences unfold, each impacting revenue in different ways.
First, revenue per dollar of tax base rises, giving government a larger share of income.
Second, production is disincentivized, as people work less when they keep less of their earnings.
Third, the tax base shrinks due to increased tax evasion and avoidance efforts.
Conversely, tax cuts can have opposite effects, potentially stimulating the economy over time.
This logic underscores the importance of long-term economic growth in revenue planning.
It's not just about immediate gains but fostering an environment where prosperity can thrive.
The exact shape of the Laffer Curve is uncertain and hotly debated among economists.
It typically starts at zero revenue at 0% tax, rises to a peak, then falls back to zero at 100%.
However, its position depends on supply elasticity, or how responsive taxable income is to tax changes.
If elasticity is high, revenue might drop quickly as rates increase, making the curve steeper.
This variability means that one-size-fits-all tax policies are often ineffective.
Policymakers must consider local economic conditions and taxpayer behaviors to estimate the curve accurately.
Studies have attempted to pinpoint the revenue-maximizing tax rate, with mixed results that highlight the curve's complexity.
For instance, research in the 1970s suggested Sweden's optimal rate was around 70%.
A 2011 study estimated a similar figure, indicating many economies operate below this peak.
This implies that, in some cases, raising taxes might still increase revenue rather than decrease it.
However, empirical challenges abound, as the maximum revenue point cannot be directly observed.
Real-world experiments, like during the Reagan administration, often led to increased deficits, showing the risks of misapplication.
The Laffer Curve has fueled intense policy debates, especially between conservative and supply-side economists.
Conservatives argue that lower taxes can boost revenue by stimulating economic activity above the optimal rate.
Supply-siders advocate for marginal tax rate cuts to encourage investment and expand aggregate supply.
Yet, Laffer himself cautioned against using the curve as the sole basis for tax decisions, emphasizing nuance.
This highlights the need for balanced approaches that consider both revenue and economic distortions.
Practical applications require careful analysis to avoid unintended consequences like revenue shortfalls.
Despite its insights, the Laffer Curve faces significant criticisms that temper its utility in policy-making.
Empirical evidence is often disputed, with some analyses showing no clear revenue-maximizing rate in modern economies.
The curve oversimplifies behavioral responses to taxation, ignoring factors like inequality and tax morale.
For example, tax avoidance isn't just about rates; it's also driven by a general unwillingness to pay taxes.
Real-world experiments, such as those in the 1980s, resulted in revenue decreases, underscoring these limitations.
Thus, while inspiring, the curve should be used alongside other economic models for comprehensive decision-making.
A crucial takeaway from the Laffer Curve is the difference between revenue-maximizing and optimal tax rates.
The revenue-maximizing rate is where tax collection peaks, but it may not align with broader economic goals.
Optimal tax rates, in contrast, aim to raise necessary revenue with minimal distortions to the economy.
This distinction encourages policymakers to think beyond mere revenue to factors like efficiency and fairness.
By focusing on optimal rates, societies can foster sustainable growth while funding public services effectively.
It's a reminder that taxation is about balancing multiple objectives, not just maximizing government income.
Research by Feige and McGee in the early 1980s identified several factors that shape the Laffer Curve's position and form.
These include the strength of supply-side effects, which affect how tax changes impact production.
The progressivity of the tax system also plays a role, as progressive taxes might have different behavioral impacts.
Additionally, the size of the underground economy influences the taxable base and revenue estimates.
Understanding these factors helps in tailoring tax policies to specific economic contexts.
It empowers citizens and leaders to advocate for systems that promote both revenue and well-being.
In conclusion, the Laffer Curve offers a timeless lesson on the delicate balance in taxation.
It inspires us to think critically about how policies shape our economic future and personal freedoms.
By embracing its insights with caution, we can work towards systems that are both revenue-efficient and growth-oriented.
Whether you're a policymaker, entrepreneur, or concerned citizen, this knowledge equips you to engage in meaningful fiscal discussions.
Let the curve be a guide, not a dogma, as we navigate the complex world of taxes and revenue.
References